COMPOSITE REAR SPOILER FEA
The aerodynamic performance of a vehicle can be greatly enhanced with the addition of a rear wing spoiler which has the ability to affect the airflow around it giving the vehicle better performance and handling. The importance of this study is to allow us to better understand which materials used for the construction of the rear wing spoiler will result in the most optimal performance while taking into consideration the material weight, cost, and structural properties along with the drag and lift performances. Structural analysis of the rear wing was conducted with the different materials along with CFD analysis to gain a better understanding regarding the differences between using various materials for the composition of a rear wing/spoiler.
OBJECTIVES
The main objective of this project is to determine the structural properties the rear spoiler undergoes during high speeds with various materials. The structural stress simulation is modeled for the spoiler with ABS plastic, fiberglass, and carbon fiber to analyze the loads and stresses that the spoiler undergoes with different materials. The airflow around the spoiler as it is accelerating is also evaluated with CFD analysis. The overall objective is to determine which material for the rear wing spoiler will give the best aerodynamic performance while taking into consideration the materials weight and structural properties.
This project is aimed to find out the differences in using metals, polymers, and composites for rear wing spoilers and why some manufacturers use certain materials instead of others. Additionally, an understanding of the mechanical behavior of rear wing spoilers made from different materials due to downforce at high velocities is also targeted. It is hypothesized that first, there won’t be much differences in performance between the 3 materials (metals, polymers, and composites) and second, that manufacturers use composite materials only for weight savings and/or aesthetic purposes.
CAD MODEL

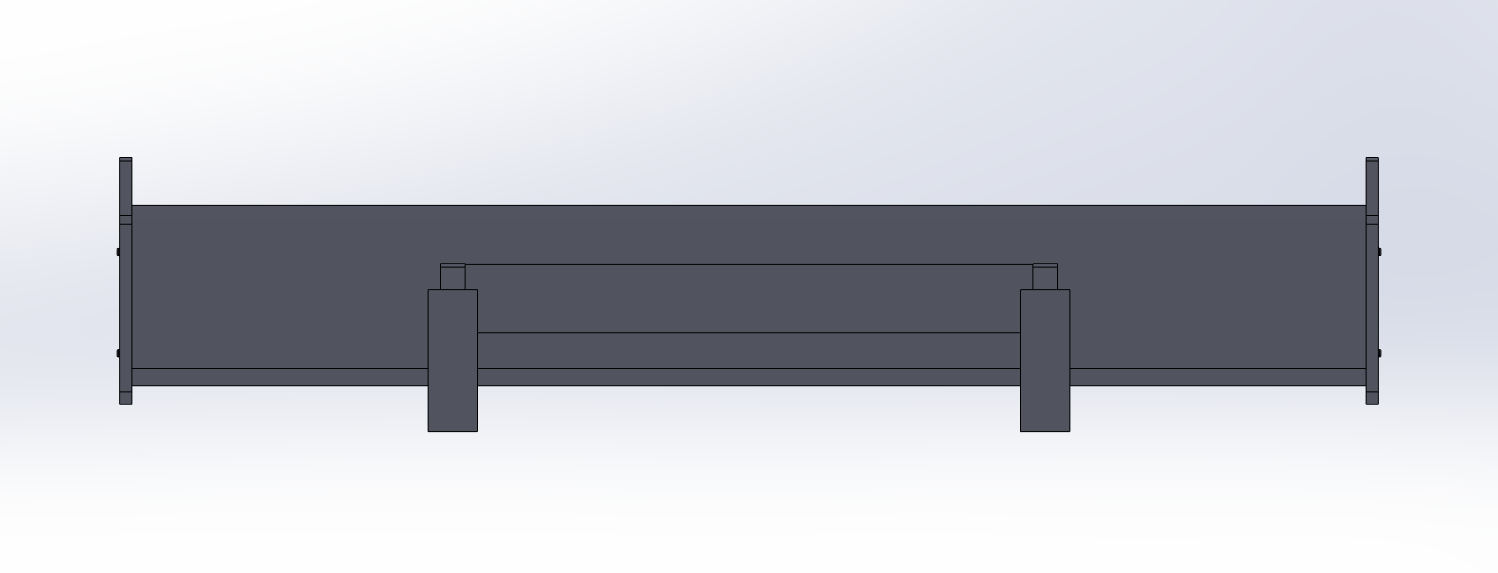


VARIABLES USED
Cross Sectional Area = 0.00189991 m sq.
Top Surface Area = 0.13098946 m sq.
Angle of Attack = 17.56 degrees
Chord Length = 0.15332 m
Span = 1 m


ENGINEERING PRINCIPLES
In order to determine the amount of downforce the rear wing experiences, which is a value needed for the FEA stress analysis with ANSYS, a rough estimate was computed using the formula for downforce, given in the equation below:
F = 1/2 x ⍴ x A x CL x v^2
Where ⍴ is the density of air, A is the area of the wing, CL is the lift coefficient, and v is the velocity.
Two assumptions were made for this calculation. It includes the value of ⍴, the air density, where it was assumed that the condition of the analysis is at SATP (25 degrees Celsius and 100 kPa) making ⍴ equal to 1.168 kg/m3, and CL equal to 0.6, referencing the NACA airfoil section 0015 graph of lift coefficients of various angles of attack, provided by Aerospaceweb.org in the image below. Interpolation of the data in the graph was not conducted, as it seems in the graph that angle of attacks of 15 to 23 degrees have a lift coefficient of about 0.6, and this variable was treated as an assumption.
Using the information from the list of variables used, the area of the wing, A, was determined by multiplying the chord length and the span of the wing, resulting in 0.15332 m^2 . For the testing purposes, the maximum allowable load on a rear wing was going to be tested, the velocity of 300 mph was used, which is 134.112 m/s in SI units.
With all of the values defined, the amount of downforce, F, the rear wing experiences, was calculated.
F = 12 x (1.168 kg/m^3) x (0.15332 m^2) x (0.6) x (134.112 m/s)^2 = 966.27 N

Lift Coefficients from 0 - 180 degrees
NACA airfoil section 0015 graph of lift coefficients of various angles of attack, by Aerospaceweb.org.
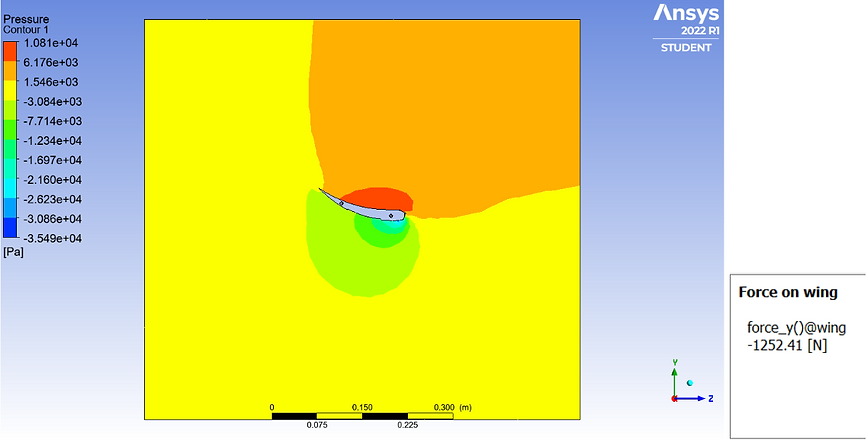
CFD ANALYSIS
To gain a better estimate of the amount of downforce on the rear wing at 300 mph, a CFD analysis was performed. The results are shown in the form of a pressure field plot and the force on the wing below. The value from the hand calculations are not too far off the value from the CFD, and this may be due to the assumptions we made being the sources of error. It was decided that the value from the CFD was going to be used, as it is a more accurate representation of the force experienced by the rear wing.
The wing model was placed in a symmetrical wind tunnel, while the discretization of the model was focused on the wing. To preserve computing power, the wing was cut in half as it would be redundant to calculate the same model twice. Due to the limitations of ANSYS Student, the concentration of elements in the mesh had to be emphasized on the wing surface and at the endplates while being neglected in the surrounding airflow. This will give us better estimations around the area of interest, and will also optimize our simulation for better performance. The parameters of the simulation are as follows: ambient air temperature is roughly room temperature (15 degrees celsius); inlet velocity of 300 mph (134.112 m/s); all wing surfaces are considered as boundary conditions; pressure at the inlet and outlet are assumed to be atmospheric pressure at sea level (101325 Pa); and the density of air is at atmospheric pressure (1.225 kg/m^3). To analyze the results, the pressure fields were plotted as a contour plot from the CFD analysis. The force on the wing was calculated by using the calculate function for force in the y-axis.
The force on the surface of the wing is 1252.41 N in the downward direction.
FINITE ELEMENT ANALYSIS
FEA PARAMETERS SETUP
MESH GENERATION


DOWNFORCE BOUNDARY CONDITION
FIXED SUPPORT BOUNDARY CONDITION

SIMULATION RESULTS

FIBERGLASS/EPOXY
Maximum Equivalent Stress based on 9561.11 Pa pressure due to downforce of 1252.41 N is 28.96 MPa.
ABS PLASTIC
Maximum Equivalent Stress based on 9561.11 Pa pressure due to downforce of 1252.41 N is 28.08 MPa.


2024 ALUMINUM
Maximum Equivalent Stress based on 9561.11 Pa pressure due to downforce of 1252.41 N is 28.43 MPa.
INTERPRETATION
